Good morning and welcome to this week’s Flight Path. Equities saw the “Go” trend continue this week as the indicator painted strong blue bars the entire week. Treasury bond prices saw the “NoGo” trend continue with a week of strong purple bars. U.S. commodities saw the “Go” trend continue this wek and at the end of the week we saw a new strong blue bar. GoNoGo Trend shows that trend in the U.S. dollar continued to be a “Go” with mostly strong blue bars.
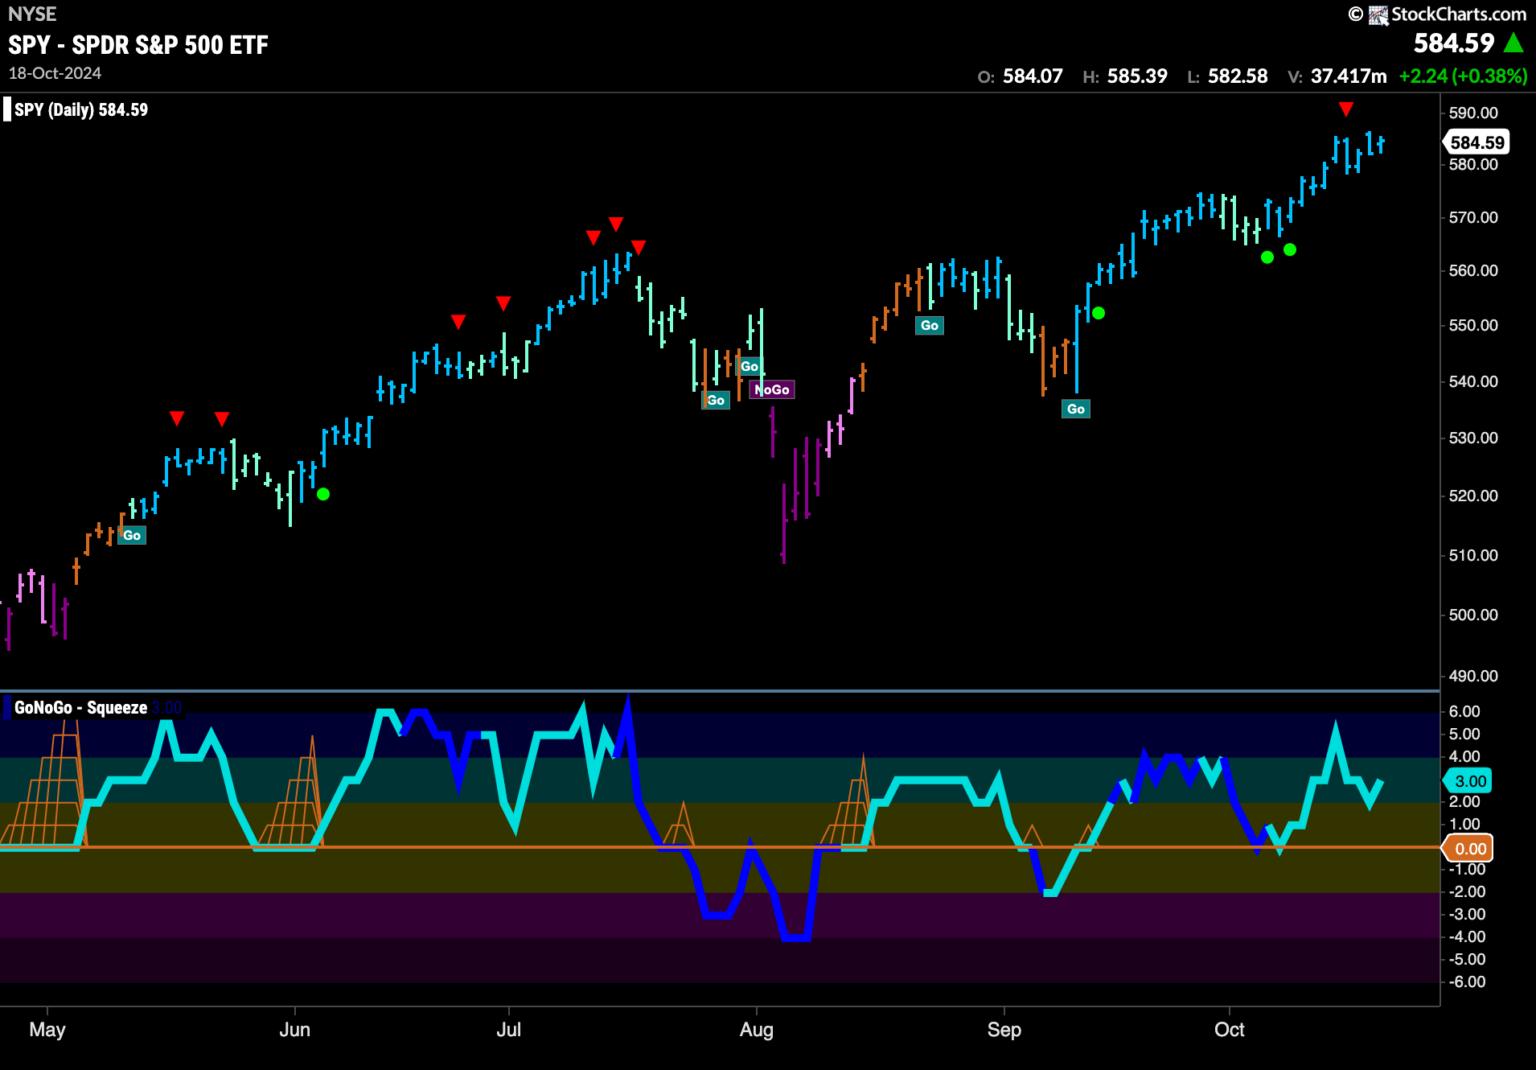
$SPY Remains in “Go” Trend with Price at Highs
The GoNoGo chart below shows that the trend is strong for U.S. equities. GoNoGo Trend paints a week of uninterrupted strong blue bars as price remains elevated and close to highs. GoNoGo Oscillator has fallen from over bought levels and is now at a value of 3. This confirms the trend we see in the price panel.
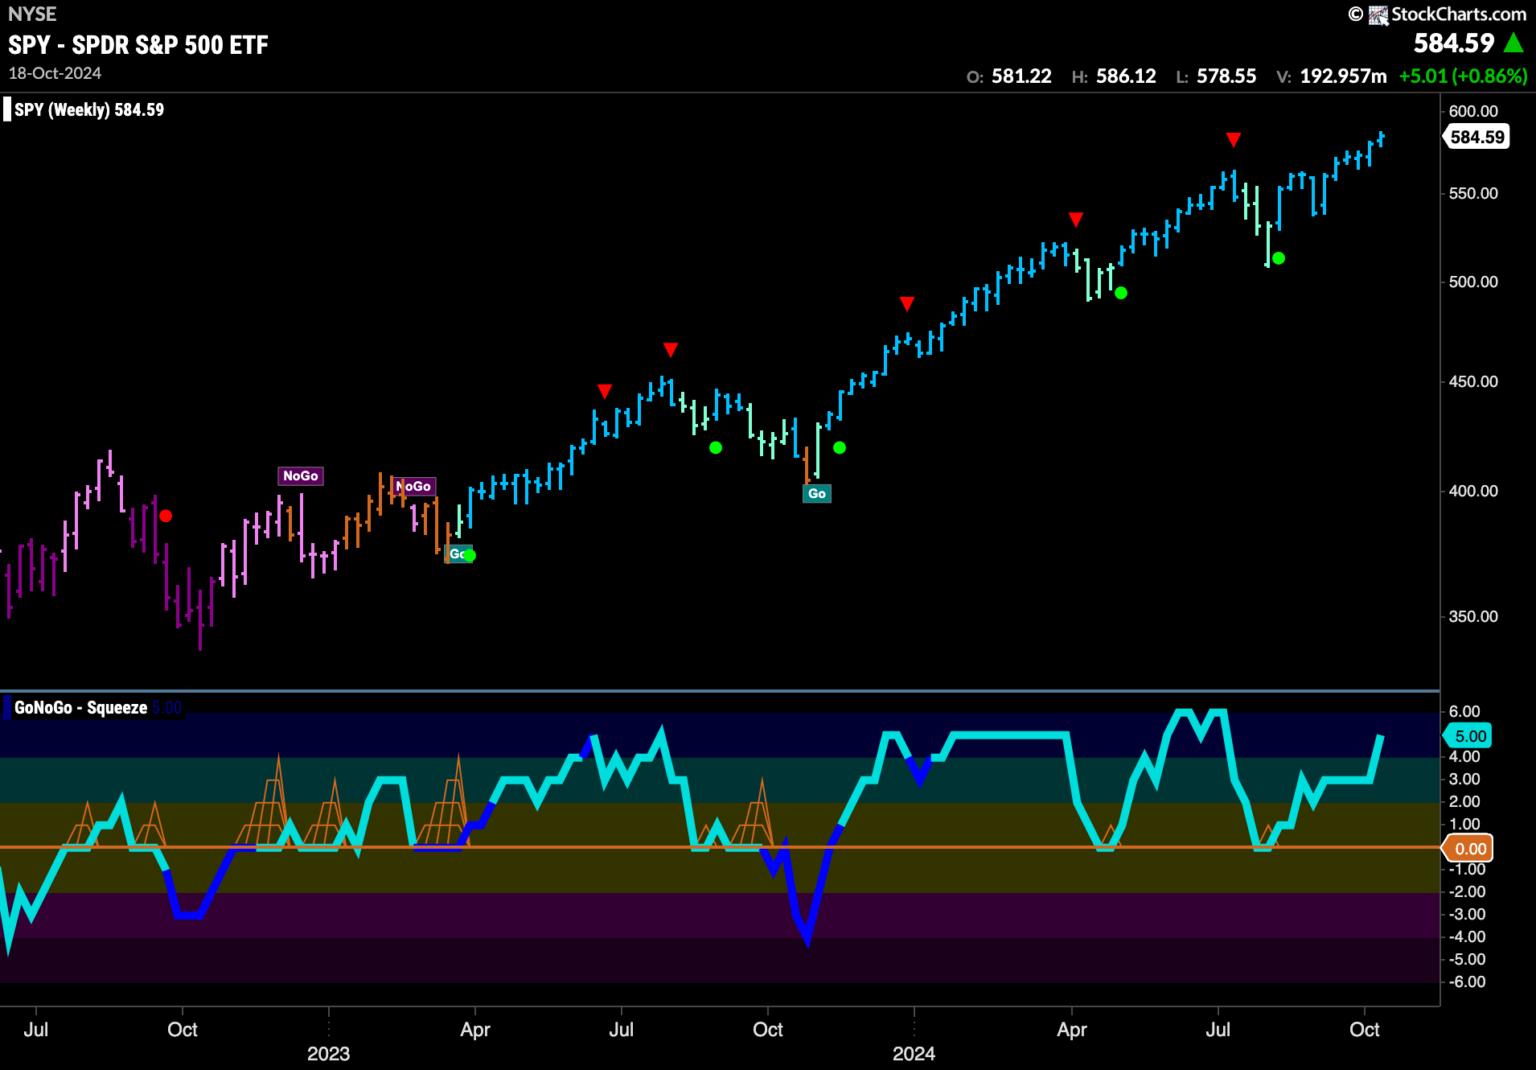
The longer time frame chart tells us that the trend is still well and truly in place as we see another strong blue “Go” bar at new highs. GoNoGo Oscillator is approaching overbought territory and this represents enthusiasm from the market as we see prices climb higher.
The “Go” Trend Survives Another Week
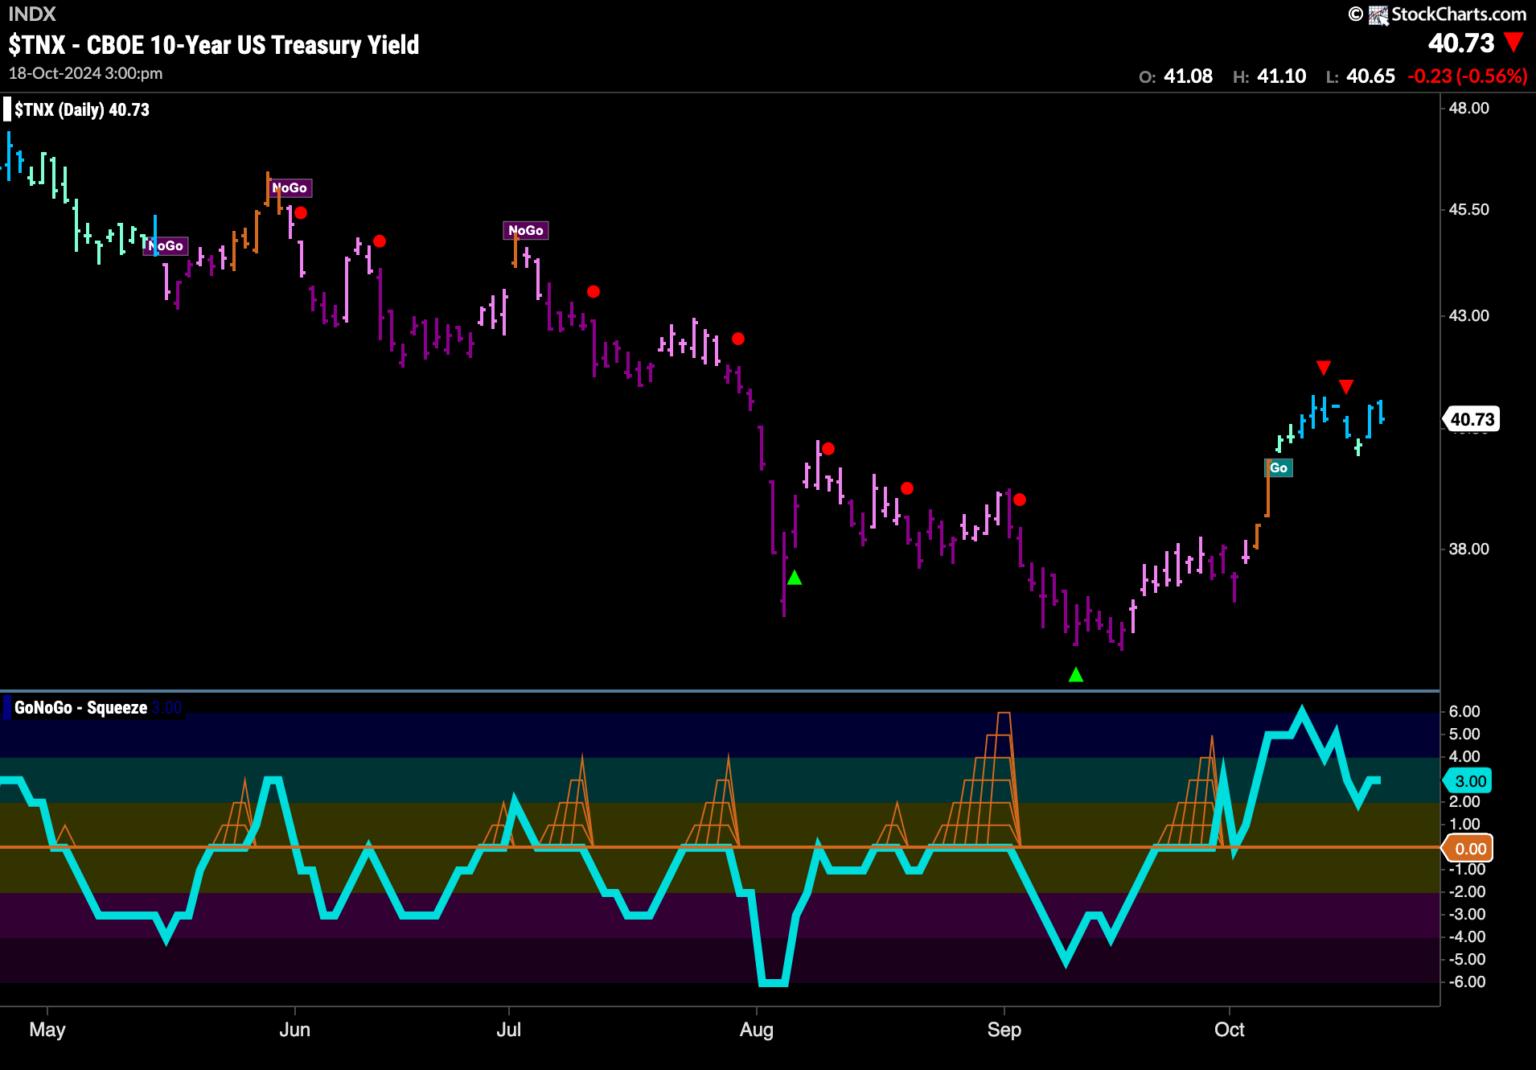
Treasury bond yields emerged out of the “NoGo” last week and now we see that this week we have been able to maintain the new “Go” trend. The indicator paints strong blue bars and GoNoGo Oscillator is in positive territory at a value of 3.
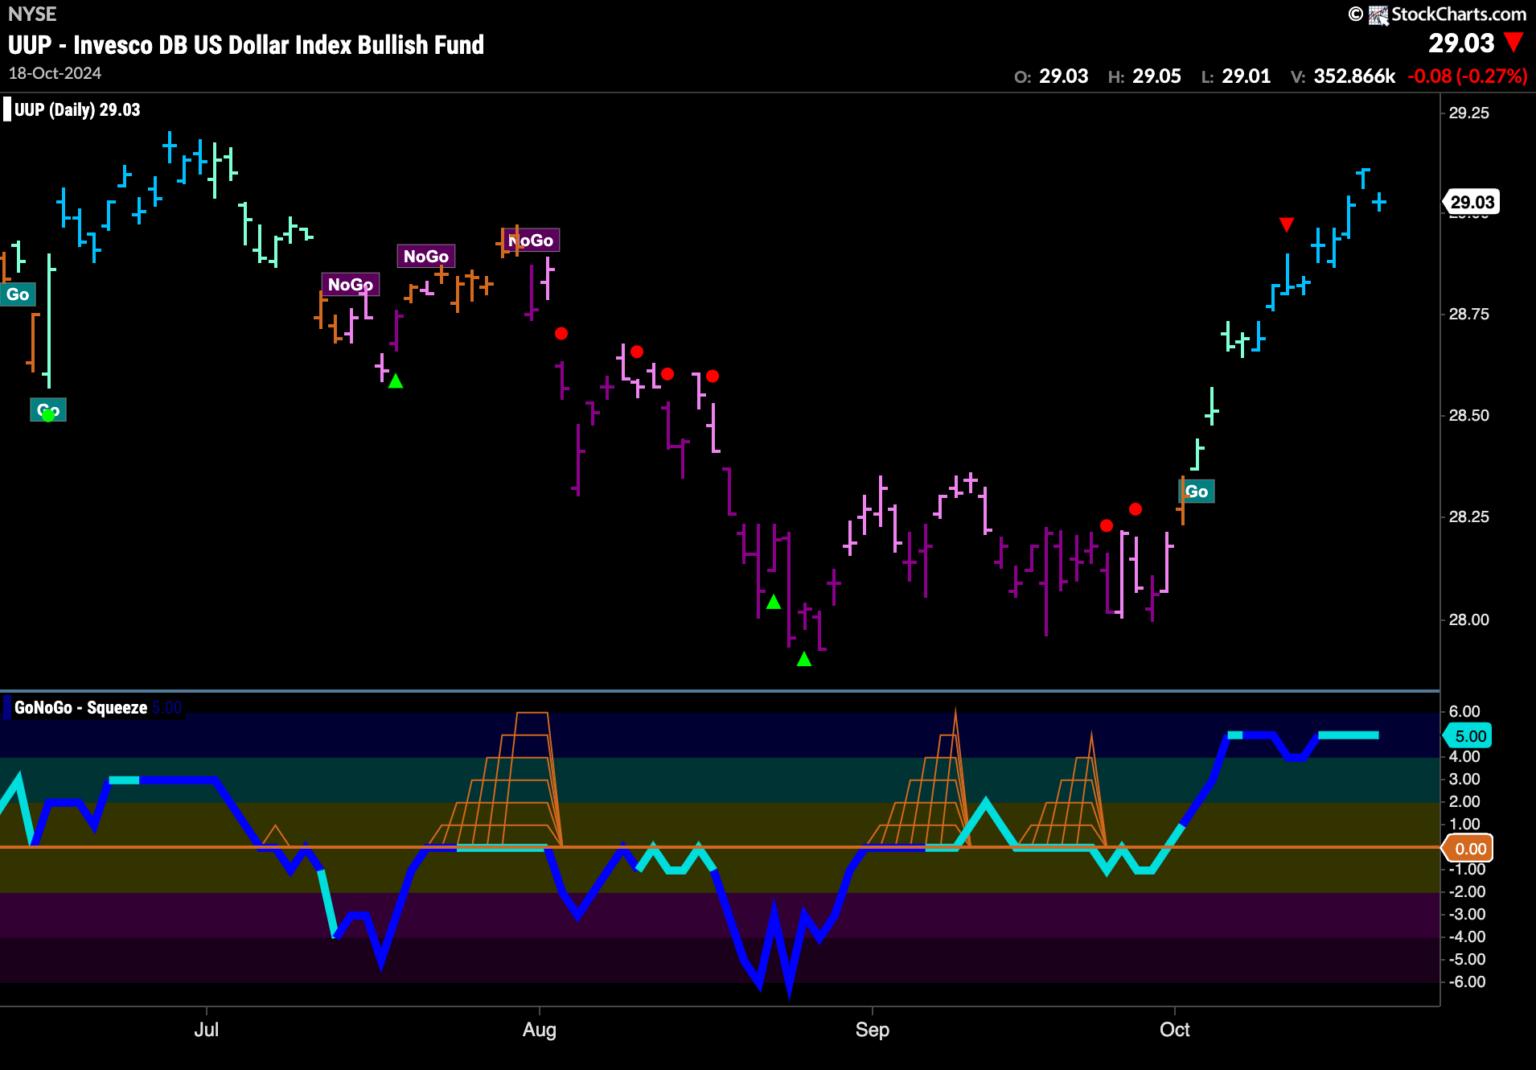
The Dollar Continues to Show Strength
Last week we saw a Go Countertrend Correction Icon (red arrow) telling us that price may struggle to go higher in the short term. As is sometimes the case in strong trends, price blew right past this warning and we saw strong blue “Go” bars and new highs this week. GoNoGo Oscillator has remained elevated this week as it stays in overbought territory.