Obviously, there will be many ups and downs in 2025 and no one chart or indicator can be relied upon 100% to help guide us throughout the year. But some key and very influential areas of the market do meet crossroads from time to time and it seems like one very important industry group is “on the clock” and should really garner our attention right now.
Regional Banks
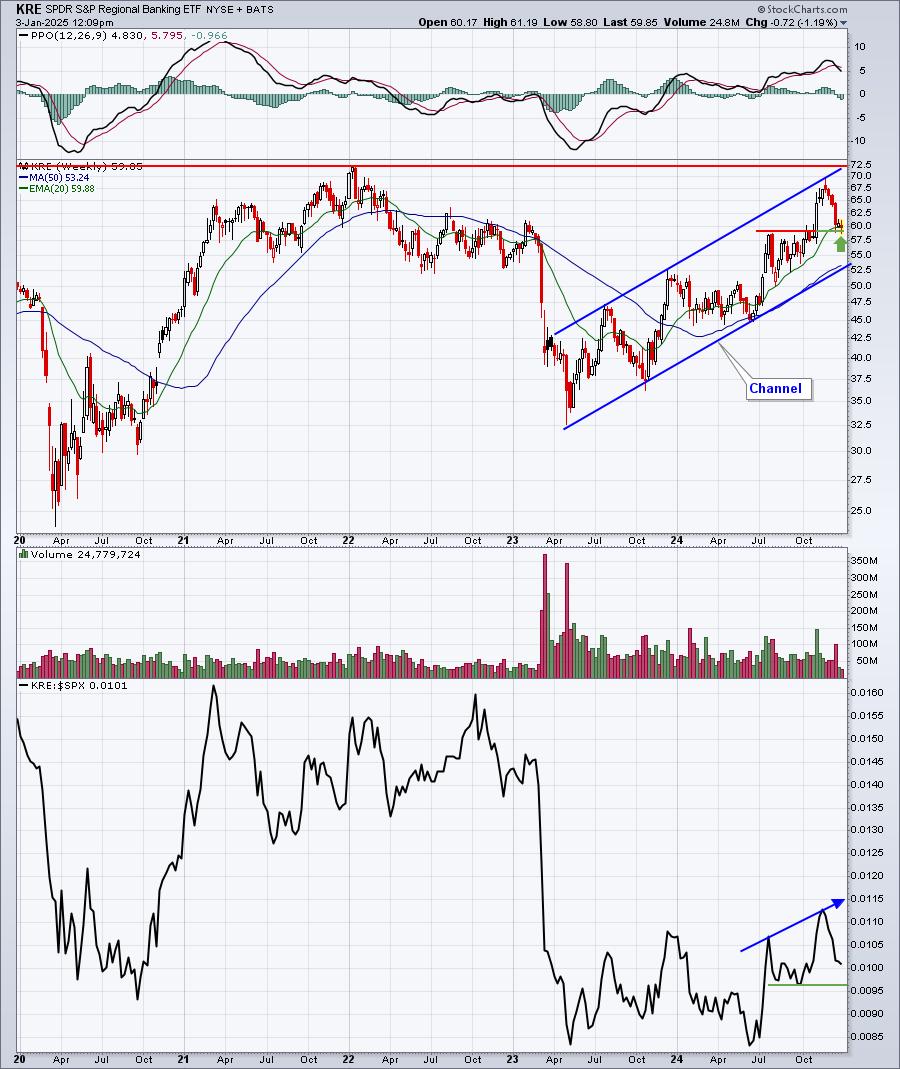
While I don’t look for market-beating returns out of regional banks (KRE) to feel good about a secular bull market, I really do want to see them participate in market advances. If we look back at the last 5 years, the KRE has been a serious laggard, but its relative strength vs. the benchmark S&P 500 has shown some life since July 2024, at the time that the June Core PPI was released. Wall Street immediately moved into regional banks in droves as the likely fed funds rate cuts ahead would directly increase profits significantly for all banks, but especially small to mid size banks. But will this newfound strength continue? Well, let’s look at the key levels using 3 different time frames.
Weekly

The big picture has clearly been improving, which bodes well for 2025. However, we don’t want to begin to see cracks in the house foundation turn into a collapsing house. I like the recovery this week after testing key price support around 59. But a drop below 59 could lead to a lower channel line support test, closer to 53. That would be another 10% drop, which wouldn’t be good. Let’s move to the next chart:
Daily

This is an interesting chart. The channel lines don’t connect perfectly, especially the lower uptrend line, but it’s close. Furthermore, the KRE printed a double bottom at 59, almost squarely on gap support that was created by the 2024 Presidential Election results. In order to feel more bullish about this chart, I’d like to see the KRE move higher and clear both the declining 20-day EMA and recent price resistance at about 61.50. For a final look at the KRE, check this out.
Hourly

This is the crack in the foundation. While absolute price support has held and we now show a potential double bottom, relative action tells us a different story as the KRE has moved to another relative low on this hourly chart. Which way will the KRE bounce? If it can clear its current consolidation range by closing above 61.50, the odds of a bullish reversal improve considerably and will likely spill over into the daily and weekly charts above. On the other hand, should the KRE turn lower again and fail to hold 58.80 price support, the hourly breakdown could lead to daily, and then weekly, breakdowns as well.
Market Vision 2025
Regional banks is just one key industry group to watch early in 2025. I see a few others that I’ll be discussing tomorrow at our MarketVision 2025 event, “The Year of Diverging Returns”, which begins at 10:00am ET. To learn more about the event and to register, please CLICK HERE.
Happy trading!
Tom


